 My name is Welles Wilder®.
Those who know me well know that I am not given to vain statements or careless exaggerations. What you are about to read is true ... every word of it. You will see what I saw and feel what I felt when Jim Sloman presented the Delta Phenomenon to me for the first time. Get ready for an unforgettable experience! I wish I could say that I discovered this phenomenon, but l’m not that smart. It all began with a phone call. It was the third week in October 1983. The essence of the conversation went like this:
"Mr. Wilder, my name is Jim Sloman. I have discovered something about the markets that I want to present to you."
"What is it," I replied, "...a trading system?"
“It’s not a trading system, although it could be used to trade the markets. If you will come to Chicago, I will show it to you. I replied that I had received phone calls of this nature before and had been on a number of wild goose chases and was not too interested in going on another one. Could he just tell me over the phone what he wanted to show me and why he wanted to show it to me.
Jim replied that he could only show it to me if I came to Chicago. He insisted that it would certainly be worth a day of my time. I asked a few questions as to the nature of his trading method.
"Does it predict or follow market action?"
"Predicts."
"Does it involve Fibonacci numbers?"
“No”
"Does it have anything to do with the works of Elliott or Gann?"
“No”
"Or Andrews or Dow or anybody else?"
“No”
"Is this a completely original discovery?"
"Yes."
At this point I was getting interested and the answer to my next question clinched it.
"Why do you want to show me your discovery?"
"I need a very large sum of money to begin another project."
"How will I know its value in order to make a decision?"
"Come to Chicago and I will show you. At that point you can decide whether or not you want to buy it.
Several days later I caught the 8:00 AM flight to Chicago and Jim met me at the airport. On the way to his apartment, I directed the conversation toward learning something about him.
Jim Sloman was a very gifted person. His intellectual abilities were first recognized in high school where he placed among the top in the country in a national exam given to all math students. Subsequently, he was awarded a National Merit Scholarship to Princeton University where he studied math and physics in special advanced classes. Jim had done many different things since college, looking for an elusive fulfillment. He started out on the corporate ladder, became a high achiever but felt something was missing. He wrote a novel, and studied film directing at Columbia University.
He had been a stock broker and briefly a commodity trader, but he left that profession because he felt he didn’t have the right temperament for it.
Soon, we were sitting in Jim’s living room chatting and I was scheduled to catch the 5:30 flight back home.
“How long will it take to show me your discovery?”
"Not long," said Jim, "but first if you wouldn’t mind, I would like to tell you how this thing, Delta, came about."
"Is that what you call it, Delta?"
"Yes. Delta is a Greek letter derived from a word meaning door, in this case a door to the unknown. It also means for me the word diagnosis, a diagnosis of the markets. A few months ago I began thinking about the markets in a way that was different for me. I attempted to find out if there was some kind of order in all markets. I visualized the markets as being a hologram. Do you know what a hologram is, Welles?"
"Yes, a hologram is a projection in three dimensions."
"Right. Do you know how one is made?"
"No.”
"A hologram is made by projecting laser light through a holographic negative - much like a photographic negative with normal lighting. However, if one looks at the holographic negative with normal lighting, it looks like mass confusion."
"When laser light is projected through the negative, then the three-dimensional hologram appears and the confusion is replaced by perfect order."
"This was my approach to finding order in the markets. Suppose the holographic negative was the markets. If I could find the right laser to shine through the negative, if there was order there, it would be immediately obvious. He asked me to come into the kitchen and sit down at the table."
"Here is a bar chart of the last nine months of Gold. It's mass confusion. Now look at this same market with this Delta overlay on the chart. Just study it for a minute."
I looked at the chart. It was overlaid with colored lines and numbers. It took about five seconds for it to hit me. I could not believe the answer was that simple.
I suddenly felt a sense of awe seeing something like no one else had ever seen. I felt like the person who had spent his life searching for something, and ended up finding it in his own backyard. (Below is the Gold chart that Jim showed me. Study it for a minute and share this experience.)
Suddenly, Jim brought me back to reality with a Question.
"Welles, where is the next turning Point for Gold?"
The last point on the chart was a low point with a circled (1). This point (1) always came just to the right of the orange line. Then I looked at point (2). It always came just to the right of the green line. I pointed to a date just to the right of the green line.
"Why, it’s right here," I said. "It will come on about October 31st." It was suddenly so clear.
"Right," Jim said, "now where will point (3) come?"
The point (3) always comes about halfway between the green line and the red line.
"Point (3) will come on about November 7th," I replied, feeling a spine tingling sense of wonder. I was shaken by what I was seeing.
"Jim, let me if I can, define what I am seeing. Gold has eleven turning points in its series. Each point has its own position relative to the colored lines. The points always rotate from high to low and low to high."
‘'You have got it," Jim said, but there is one more facet to it. Look at the second point (1) on the chart, which came on February 7th. It begins as a low point (1) and starts moving up to a point (2) high due about March 7th."
"But, on the fifth day of the up move, the market turns around and plummets down to make point (2) a low rather than a high point. Point (2) maintains its position relative to the green line, but it is a low point rather than a high point. _ This is what I call the inversion. This inversion can only happen on either side of point (1). From then on, the high/low rotation continues to the end of the series."
"I note that you have put a dotted circle around the second point (1). What does that mean?'
"That denotes what I call the in-between point. Obviously, the only way the inversion can occur is with an in-between point. This is an extra point that comes between point (1) and point (2). It causes the new series to invert its high/low rotation, which will continue until the next point (1). There is one other very important thing. Big moves tend to come on either side of point (1). Notice the big downmove after the point (1) high in February. This does not happen consistently at any other point."
"Jim, are you saying that every market has its own order, just as we see here and this order will continue forever into the future with this same discipline we see here?"
“Welles, this is true for every freely traded market (stocks or commodities) to which I have applied the Delta order. I believe it will continue just as you see it here forever into the future because the natural order upon which it is based never changes no matter how far one projects it into the future. But you will just have to prove this to yourself. "
"How is Gold different than, say T-Bonds, as far as the Delta order goes?"
"Just two things; the number of points in the series and the position of point (1) relative to the colored lines."
"This is totally amazing, Jim. Are there longer or shorter time frames for Delta?"
"Yes, what you have seen is what I call the intermediate Delta time frame. I have also discovered a Long-term Delta time frame. It operates exactly like what you see here except for the spacing of the colored lines."
"I believe there are other, as yet, undiscovered time frames. If so, the only difference will be the spacing of the four colored lines."
"Okay, Jim, now for the moment of truth. What are the colored lines? How are the colored lines determined?"
"The secret for every Delta time frame begins with these six words. Markets repeat directly or inversely every...”
(You will learn this secret when you buy the book. Obviously, you as a potential book buyer and future user of the Delta secret, and I as a trader, don’t want this secret to be used by those who have not made an investment in it.)
When Jim told me the secret, I was even more amazed that it was so simple and so logical. Once you know it, you will know that is what it has to be.
The Deal Unfolds
For the next several hours Jim and I studied charts of fifteen different commodities. What I had seen on the Gold chart held up perfectly. Jim also showed me several "Long-term charts." Instead of the points coming every couple of weeks or so, the Long-term points came every few months.
(Every chart Jim showed me that day in Chicago is reproduced in the Delta Phenomenon book.)
The only variables were the number of points in the series and the position of point (1) relative to the colored lines. It had been several hours since we had arrived at Jim’s apartment and I now knew both the Long-term and Intermediate-term Delta. Jim sensed that we had come to the point of decision.
"Well, Welles, is Delta worth what I am asking you to pay for it?"
I thought to myself, of course it is worth it, and what’s more, I already knew it.
Jim," I answered, "let me see if I understand this deal. If I pay you this sum of money, does it mean that Delta is mine to do with as I choose? Does it mean that you will tell no one else the secret?"
'Exactly,' said Jim. 'I would like you to know my feelings on two things. One is that I would like to think that this knowledge would not die with you. I would like you to make the fruits of it available somehow. The second is that you would give me credit for discovering it."
"However, Delta is yours - you do not have to do either of these things."
"Would you agree to consult with me if I should have questions on this in the future?"
"Yes," Jim replied.
I said, "Jim, you’ve got a deal."
I sat down and wrote Jim a check for a large sum of money.
Handing Jim the check, I had another question. "Of all the people to whom you could have chosen to sell Delta, why me?"
"Welles, I read one of your papers, and something said to me, this is the person that should have it. The only way I could sell it was first reveal it to a buyer, then once he knew it, why would he buy it? That was my problem. Somehow I knew you would pay for it even after you knew it."
"Jim, I’ll have to admit, the thought flashed through my mind to make you a counteroffer for less money. Then I remembered that just a few days ago I found out that I was going to receive almost exactly this sum of money from an investment that I had made several years ago."
"I have learned that when things come together like that, you don’t fool around with them. Too many good things have happened for me not to believe there is a reason behind them. In the same way you trusted me with Delta I trust you when you tell me you will reveal this to no one else."
More Verification
On the plane back home that night, my mind was racing over the different courses of action to take from here. There was so much work to be done. Each market had its own characteristics to Delta. Jim had identified these characteristics for the Intermediate - term for fifteen markets and for three Long-term markets. Also, I wanted to go back about ten years or so for each commodity and tabulate the Intermediate-term Delta turning points. To tabulate the, Long-term Delta turning points required going back even farther when the data was available.
I decided to commit all of my time to this project. To remain completely objective and undisturbed, I would refrain from trading until the project was complete. I had applied Delta to more than two hundred years of daily charts covering twenty-five commodities and more than three hundred years of monthly and weekly charts.
For the next few months I rarely went into the office but stayed home where there were no quote machines or telephones to distract me. Six months later the project was almost finished.
It was unbelievable how the Accuracy of only nine Months of charts that I brought back from, Chicago held up through all those Years. Of course, Jim knew it would, but I had to prove it to myself.
During this intensive study it became more and more apparent how Delta is the basis of all market movement. Delta is not a market follower, it is the reason for all cyclic market phenomena. When the study was almost finished I called Jim and invited him to come to my office for a week to verify my findings. When Jim arrived we both worked night and day on the project. Jim went over every chart in detail. He also worked out the Long-term Delta for the rest of the markets.
The Delta Mission
During the last six months of research and study into Delta, a thought kept popping up in the back of my mind.
The Delta discovery was too significant not to be shared in some way with others. The secret must be kept secret but the results and capabilities of Delta should be shared.
The secret also would have to be passed on to succeeding generations, but how could this be done? I considered publishing a Delta trading letter but just couldn’t fathom the idea of being tied down to getting out a letter every week.
Since October, I had been following Delta every day on my daily bar charts. I had made an overlay for each chart, which showed the location for the Delta Intermediate-term turning points.
I began to draw vertical bands on the chart where the future Delta turning points should be. Usually the turns came within a day or two of the midpoint of the band.
One day it occurred to me that I could increase the accuracy of determining the turn day if I knew the average date for that point for the documented history of Delta for that commodity.
I took it one step further. I posed the following problem - what day, plus or minus two days, will have the highest accuracy? How about plus or minus three days - or four days? How about a way to rate the accuracy of each turning point?
I already had the data necessary to determine this from the two hundred charts. It was just a matter of designing a computer program to analyze and categorize the information.
Several weeks later I had the printout for each commodity, which I kept with each chart. I now knew the probability that the turn would occur within a specific time frame for each point. I also knew which tuning points had a history of being the most accurate. After utilizing this information for a few weeks, I had another idea. With this new information, it was now possible to design a computer program that would print out the turning points with the probabilities for all commodities, past, present and future. This thought was staggering, yet all of the information was available to do it.
I designed a computer program and put my programmer to work on it. He did a brilliant job and had the program completed in six weeks.
It's Hard to Believe
Suddenly, it hit me that I could do this for any date in the past or the future. I could pick a year - then pick a commodity - for example, T-Bonds 2015. I can chart every Intermediate turning point and every major turning point that T-Bonds will make in 2015.
Or better yet, pick a date - any date - say March 22, 2030. I can determine the previous turning point, the next turning point and the following turning point - for every commodity I choose on any Delta time frame I choose.
How Accurate Are the Delta Turning Points?
For all twenty-five commodities, which include over 200 years of observing the Delta phenomenon, the average accuracy for all Intermediate-term points is as follows:
[1] 51 % of the time the projected Delta turning points will occur within two days of the projected day.
[2] 68% of the time the projected Delta turning point will occur within three days of the projected day.
[3] 81% of the time the projected Delta turning point will occur within four days of the projected day.
The average accuracy rating (AR) for all Delta intermediate turning points is 27. This means that the average distance of every Intermediate-term Delta turning point from the projected date is 2.7 days.
I know it sounds incredible to make the statement that all Intermediate turning points in the future will maintain this accuracy. I was convinced of this only after researching this phenomenon over two hundred years of daily data and over three hundred years of weekly and monthly data.
(After trading the Delta turning points for the last 18 years, I can assure you that the 2.7 accuracy rating is just as good, if not better than it was in 1983!)
Putting It All Together
Many of the pieces of an idea for sharing Delta had come into place except one. Who would believe it? I could offer to sell or lease the computer program that gave the Delta turning points, but there was no way I could prove that Delta was so unbelievably accurate without actually revealing the secret as a part of the proof.
I mulled this over for a couple of weeks and then one morning at 3:00 AM the solution came. The answer was THE DELTA SOCIETY INTERNATIONAL.
THE DELTA SOCIETY INTERNATIONAL would be the guardian and perpetuator of the secret. There would be two types of membership; Members and Directors. Now I was ready to share the Delta Phenomena and recoup some of my initial investment.
That was 1984 and that ends the amazing story of how Delta was discovered.
Now, Many Years Later
Now, many years later, let me quickly bring you up-to-date. Then I will show you a number of ways that you can make profits with Delta. . . after all, that’s why you are reading this, isn’t it?
Originally there were the two Delta time frames, the Intermediate-term which uses daily bars and the Long-term, which uses weekly bars and on some commodities, monthly bars.
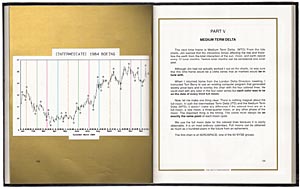
At a Director's meeting in London in 1985, Jim presented the Medium-term Delta time frame (MTD). The MTD uses weekly bars and fails in between the Intermediate-term and Long-term Delta time frames.
Jim's next project was called the Short-term Delta time frame (STD). The STD uses intraday data. The bars can be anywhere between 5 minutes and 20 minutes long.
At about the same time, Jim discovered the Super Long- term Delta time frame (SLTD). This uses yearly bars. When you read the book you will see how this time frame predicted the 1987 Stock Market crash. In fact, you will read my June 30, 1987, Delta members letter, which predicted the crash, would be of the 1929 type and would come in September 1987. That missed it by three weeks.
You will also see that anyone who had that chart and the LTD chart could have made the same prediction.
The Final Chapter
The final chapter of what I sometimes call The Delta Saga began in the summer of 1990.
As I mentioned previously, one of the Delta Directors broke his contract and conveyed the Delta secret to a friend who tried to publish it in a book.
I hired lawyers and was able to stop him, but I knew the secret was out and it was just a matter of time before someone published it, probably in an overseas publication.
I made a proposal to the Delta Directors that I publish the book, obtain patent rights and copyrights and share the proceeds of the book with them. They agreed. That's why you are reading this report.
Turning Delta Information Into Profits
Now let's get into the fun part of this report ... making a profit in the markets!
There are a number of ways to do this. One way is to just use the pure Delta information to read and trade the markets.
Another way is to use the Delta information for trade selection for any trading system that you may want to use.
This trade selection factor alone, can increase the profit of any trend following system I know of, by as much as 50%. The idea is to only take the trades that are concurrent with Delta turning points. Another way, of course, is just to trade the Delta turning points.
Let's look at the chart of the British pound (which is also displayed on the front cover of this report).
In the book, I present three simple, visual chart trading systems which I have used for more than 20 years, and I still use them today.
Any of these three trading systems will give you a place to enter a trade when the market is at a Delta turning point. The idea is to wait and enter when the market tells you the turn has been made.
On the chart of the British Pound, this simple trading system made 12 trades; 8 profit trades and 4 loss trades. The total Profit was $11,650.00. The total Loss was $3.350.00. The Profit was $8,300.00.
Of course this does not take into account commissions or any slippage that might have occurred in actual trading. The trading period was 11-22-96 through 05-16-97.
Notice that this is not a trending market. Except for the big downmove after the Long- term Delta point [1] high (colored in blue) most trend traders would call this a choppy market.
However, using the Delta turning points with this simple mechanical trading system generated some pretty amazing profits for a non- trending market.
This system is based on the Delta turning points. Without them, it would be like trading in the dark! This is not meant to be any kind of track record. It is just an example of trading the Delta turning points. When you get the book, you can apply this simple system to this market and any other market shown in the book with Delta turning points.
Now, let's talk about another aspect of Delta. That is, utilizing the Delta turning points for reading the markets. Remember, Delta is the basis for all market movement.
First, notice the big move after the Long-term Delta point [1] high (colored in blue). This was to be expected because we know big trends very often begin at point [1].
If a high point comes early, that is a tip-off that the market is very weak and should be shorted at the first opportunity.
For example, notice the intermediate-term point (8) high. This market was struggling to move up to the point (8) high in January 1997. It made one final attempt to move up to the point (8) high, and then collapsed.
This trade would have been like a sitting duck to a trader who was using Delta to read the markets. He would have taken a "short" trade when the market moved down past the point (7) low because that confirmed that the point (8) high was in, although early. Also, a high point that comes early is a tip-off that there is underlying weakness in the markets. An example of this is the early point (2) high in March 1997.
Due to the strength of the up-move from point (3) to point (4) the chart reader would have expected point (4) high to be late. These are just a few of the things you will learn in the Delta book about using the Delta turning points to read the markets.
Long Term Delta
How would you like to know that a market is going to move up for the next four months and then down for the next three months? Most people would just laugh at such a suggestion. They will jeer and say, "Nobody could ever know anything like that!"
Before the Delta Phenomenon was discovered, they would have been right. But now, a few traders know that this is not only possible, but they have seen it happen so consistently, time after time in market after market, year after year, that they take it for granted! The chart above is a weekly bar chart of T-Bonds for the last two years; a favorite market for most traders.
The Long-term Delta turning points on that chart were discovered and locked in concrete in 1984. They are just as accurate now as they were then.
Proof of the Hidden Order
I asked a mathematician to make the following calculation.
If there is not perfect order in the markets, what are the chances that One could know in advance that T- Bonds would make the highs and lows (in high/low rotation) as shown on the chart? The answer is one chance in 322 billion! To be exact, 1 in 332,687,692,541 that the turning points on the chart could have been known before they happened.
Do investment bankers and financial institutions worldwide know this?
Yes, some do, but try to tell this to your average banker and he will think you are some kind of a nut! I know, I've tried!
But I have heard from a few people in major financial institutions (mostly in Europe) who read this book and believed it In fact, they used the knowledge in the book to find the order in the European currency, bond and stock markets.
Are these bankers telling anyone about the Delta order? Not hardly! They have something that gives them an edge in competition with other financial institutions. They are not about to let anyone else in on it! So, how else can this information help you to trade the markets? Perhaps this sounds like a dumb question, but maybe I can point out some ways that you haven't already thought of.
[1] At every Long-term Delta turning point, there will be a coming together of Medium- term and Intermediate-term Delta turning points to pinpoint the major turn.
This allows you to get in the market at the beginning of the move with a reasonably close stop.
[21 Trade only in the direction of the major trend. If you know that an up trend is going to last for the next three months, then take only long trades.
[3] Trade selection. For example, you can construct a trading window for any Long-term turning point by using the Medium- term points on either side of the Long- term point. You can apply any trend-following trading system to only enter trades while in this window.
It is my experience that this will increase the profits of any trend-following system by 25% to 50% and in some cases, even more.
Short Term Delta
Short-term Delta shows the order in all markets on an intraday basis. That's right, believe it or not, the Delta order extends even to within the trading day.
The bars in this case can be of any period of time up to 20 minutes. Fifteen minutes is the period used in the above chart. Notice the same colored lines, except here the lines represent a different period of time. You will note that in this time frame only, there are some double lines that break up the numbering sequence. That's a bit technical to go into, but the book explains it in detail.
I have shown this chart to give you an example of the scope of the shortest Delta Time Frame and to show even more evidence that the Delta order is the ultimate basis of all market movement . . . the basis of all technical analysis.
The Delta Phenomenon is a Very Special Book.
I'm certain it is the last book I will ever write about markets. I have tried to write it in such a way that it will be an adventure - a road to new and unbelievable revelations about things never known before.
The book takes you step-by-step through the unveiling of each Delta time frame and the beautiful logic behind it. You will feel what I felt and experience the same spine-tingling sense of awe as the Delta order unfolds with each new time frame.
 The book is in color and is almost as beautiful as the logic it contains. Remember, the Delta overlays that instantly bring out the innate order in the markets are in color. Without the colors, it would just not be visible. Anybody who tries to copy this book would have to copy it in color and that would cost about as much as the book!
I have never made a customary money back guarantee on this book. Two reasons: First, the Delta secret is not available for free to those known in our trade as "library readers" who return every book they buy. Second, anyone who wants to learn this secret has to exhibit "one-half of one percent" as much faith as those who paid $35,000 to learn it. Therefore, when you purchase this book – It is yours. That's not likely to be a problem. Of the 35,000 people who have purchased This book since 1990, I know of only 26 who were not satisfied. I know, because I kept count!
Those who know me well, know that for many years I have had a great interest in the futures markets. I have seen many, many systems and methods in my time, some of them of considerable merit. I have had the privilege of developing a few of them myself. Those who know me well know that I have tried to live my life with integrity and fairness. I enjoy the markets, I enjoy the challenge they present, and from time to time, I have made available personal trading discoveries that I felt were good and useful.
But, from the moment I first came across Delta, I have never again been able to look at the markets in the same way. This completely new perspective is what I have attempted to convey to you.
And now you can have access to the very same information that I have. You can know the Delta secrets and know how to take maximum advantage of the market's innate order.
You will be able to see and use the predictive features of Delta - so you can have superior information and knowledge when trading the markets.
You can go as far as you want with Delta. If you don't want to take the time to construct the Delta overlays and determine the Delta solution for all the markets, Membership in The Delta Society is again available, just click on Products & Services, then Memberships from the drop down menu. Most of the time, there is a special offer in effect so click the Special Offer on the left side of the page to view.
Also available to Members and Directors is a computer charting program called "Delta Graphics," which puts the Delta turning points on your computer generated bar charts in full color. The daily data can be manually input or updated daily through the internet at one of a dozen or so data banks at a very nominal monthly charge.
The Delta Book
The Delta book contains nearly 100 color illustrations. Its 193 pages are bordered in gold with gold inlaid covers in a rich leather-like material.
We know you don't want to wait for this book, so we will ship via Priority Mail or UPS - the same day we receive your order. We will also pay the freight! (Overseas orders add $15.00 at time of shipment)
Wrap up
Although the Delta information is predictable and accurate, it will not be a panacea that will make all traders rich overnight. I know traders who could not make a profit trading if they had tomorrow's Wall Street Journal! The forces of fear and greed make it difficult for most traders to follow a plan even when the plan is based on accurate predictions of what the markets will do.
However, if the Delta predictions are handled with objectivity and discipline, the results can be most rewarding. I don't keep up with all Directors regarding their trading, but I know which ones are doing the best.
When Jim Sloman finished the last Delta chart back in 1984, he looked up from the table and made a statement that I will never forget. He said, "Welles, it's like having a road map into the future. What an incredible advantage to those who have it." I urge you to call or send in your order now. You will be immensely pleased with the wonderful insights and powerful knowledge base that will be yours. For the cost of a few commissions on a few trades you will have this powerful, unique information that will work for you for years to come.
Sincerely,
Welles Wilder®
PS. If you have questions, call my office (336) 698-0500 (9AM – 5 PM EST).